Maps, Matricals, and Material Remains An Archaeological GIS of Late- Eighteenth-Century Historic Sites on St. John, Danish West Indies
(Excerpted by permission from Archaeology and Geoinformatics-Case Studies from the Caribbean, edited by Basil A. Reid. The University of Alabama Press, Copyright 2008, By Douglas V. Armstrong, Mark W Hauser, David W Knight, and Stephan Lenik)
The steep and rugged landscape of St. John along with its irregular rainfall made it marginal to the capital interests of the Danish West Indies. While mercantile trade was central to the economy of St. Thomas and the plantation economy was well suited to St. Croix, the setting of St. John contributed to its peripheral role as a mixed plantation and provisioning economy. This marginality, in combination with the mixed motives and objectives of the Danish colony, produced a setting for social relations that have been described as an incomplete hegemony. This landscape facilitated the development of negotiated freedom for persons of color. In this chapter, we use GIS to integrate the documentary and archaeological records in order to reconstruct the social context of ownership and control in eighteenth-century St. John, Danish West Indies. We found that in the late eighteenth century, free persons of color on St. John took advantage of the relative flexibility in the Danish land-tenure system to establish informal and formal landholdings for themselves and their families in the less contested lands of St. John. This study uses historic maps and tax records (matricals[1]) along with the material remains and ruins of archaeological sites to reconstruct cultural transitions and emerging venues for freedom.Perspective on St. John and the Danish West IndiesSt. John was one of three principal islands of the Danish West Indies (along with St. Croix and St. Thomas), an island group acquired from Denmark by the United States in 1917. St. John, along with other islands in the Virgin Islands group and the neighboring Lesser Antilles archipelago, represents an element of diversity in scale within the Caribbean region. As Barry Higman pointed out for the Lesser Antilles as a whole, the smallness of scale and economic scope of the smaller islands of the Caribbean have led to distinct variations in the overall pattern of land use from island to island in the region (Higman 1995:8). In contrast to larger islands in the Caribbean like Hispaniola (Haiti and the Dominican Republic), Jamaica, Cuba, Puerto Rico, or even Guadeloupe, where an array of environmental zones, soils, and climatic conditions produces a wide range of settlement types and economic production systems, St. John’s environmental setting provided a limited range of options.While St. John was suited for provision production (foods to coal production) and maritime trades (fishing to the harvesting of coral reefs), its landscape and irregular rainfall yielded land that was only marginally suitable for the production of sugar, particularly as compared with the scale of economic production of its larger neighbors throughout the Caribbean-including the Danish island of St. Croix. Moreover, its undulating shoreline and steep slopes tended to enhance isolation and worked against controls that could be enforced by colonial regulation. Added to this is the fact that the Danes were only a minor player in the colonial arena and their interests, although tied to plantation-based agriculture, were more strongly tied to maintaining a foothold for mercantile trade on a global scale and less to land-based expansionist or imperial designs. Their agenda was to sustain a neutral base for trade within a sea controlled by naval powers including the British, Spanish, French, and, later, the United States.Thus, St. John and many of the smaller islands of the eastern Caribbean, including its near neighbors Tortola, Virgin Gorda, and Peter Island, as well as Anguilla, Saba, and Nevis, represent settings of micro diversity within the broader Caribbean. On these islands, the narrow range of economic options combined with the smallness of scale to produce very distinct settings of insular diversity. St. John was at once an element of the broader social and economic structure of slavery, colonialism, and imperialism (Goveia 1965:52-53) and also an example of the fragmentation and idiosyncratic nature of local social and political interaction (Hall 1985; Higman 1988, 1996:1; see also Higman 1995:9)Cartography of the Danish West IndiesA fascinating aspect of Danish West Indian history is that no formal set of maps was produced until 1780. When a set of maps was finally commissioned, the cartographic objectives for the island of St. John remained peripheral to the central goal of generating maps and plans of harbors and fortifications in order to evaluate defense systems for stable trade for the Danish foothold in the region.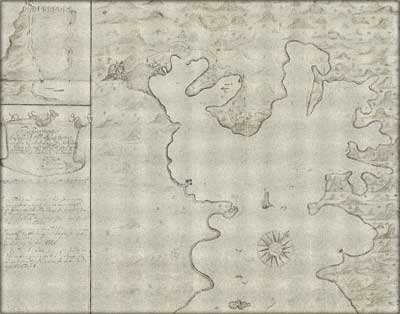
Map of Coral Harbor,1720
(Rigsarkivet, Copenhagen)In 1776, a Danish ship was seized by a British naval vessel at anchor in front of Fort Frederiksted, St. Croix (Hopkins 1993:29). The Danes were outraged, but, more important, they felt threatened by the implications of the ease of which their multinational trading system could be interrupted by a foreign power. As a consequence, the Danish government began to investigate the colony’s defenses. As part of this exploration, a series of maps was commissioned by the Chamber of Customs upon petition to the King’s council. In a report to the Chamber of Customs, General Huth indicated that the islands were “of all together too great commercial importance for the colonial administration to be without accurate maps of them” (Hopkins 1993:30, after Huth in DVFV-I 1777a). Huth recommended that the survey job should be carried out by Lieutenant Peter Lotharius Oxholm, who had worked with him on the Eider Canal Project in Denmark (DVFV-I 1777b).Funding was approved to send Oxholm “to survey the island’s defensive works and prepare maps of the island” (DVFV-I 1777b). The request acknowledged the existence of a detailed map of St. Croix by Jens Beck. Beck’s map provides remarkable detail of plantation layout and illustrates the very structured rectangular plantation layout of St. Croix. However, the map did not contain information on topographic relief or hydrographic detail. These latter details were, by the 1770s, considered essential to withstand a siege on relatively dry islands.[3] For St. Thomas, the Chamber noted the existence of a 1719 map by van Keulen with information on relief and defensive structures, but argued that it was “old and in certain respects unreliable” (DVFV-I 1777b; Hopkins 199J:30). As for St. John, the Chamber simply reported that “there is nothing beyond what is depicted on said v. Keulen,” a map that provides no details on the cartography of St. John (DVFV- I 1777b). In fact, soon after the formal settlement of St. John by the Danish in 1718, a French team had produced a map of the settlement and fort at Coral Harbor.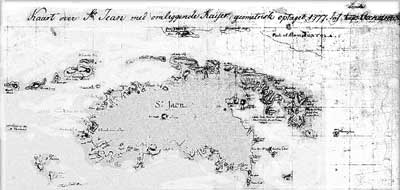
Oxholm’s 1777 draft map of St. John
(Rigsarkivet, Copenhagen)The dominant theme in Oxholm’s orders was the need for details on defense against possible attacks by other nations or raids by privateers. They were also concerned about the possibility of rebellion of slaves and the protection of water supplies in the event of a siege. Oxholm was given explicit orders to document and evaluate each island’s fortifications (Hopkins 1993:33). He was to draw all forts and batteries, “together with the harbors and stretches of land lying immediately adjacent, all in plan and profile, so that such maps and drawings could always be available here at hand in the future and so that one could know and judge of the defense works’ form, situation, and strength” (DVFV- I 1777c)[4] Thus along with the maps, Oxholm was ordered to report on conditions, including detailed suggestions for improvements. These instructions ultimately resulted in detailed notes on the cultural setting and conditions on St. John. The notes, written in association with the production of the 1780 map, are of considerable value to the interpretation of the island’s cultural landscape and provide vivid detail of the problems encountered that encumbered production of a map as detailed for St. John as he was able to produce for St. Croix.Peter Oxholm arrived in the Danish West Indies on March 14, 1778. In the Danish West Indies he found a setting that was far different from that which he had encountered in mapping canals in the relatively flat and open landscape of Denmark. He was confronted by a multitude of languages, including Dutch and English, all spoken in local Creole dialects. He quickly determined that Beck’s map was relatively accurate and that resurveying the whole of St. Croix was unnecessary, and too expensive, so he focused upon drawing plans of fortifications and harbors.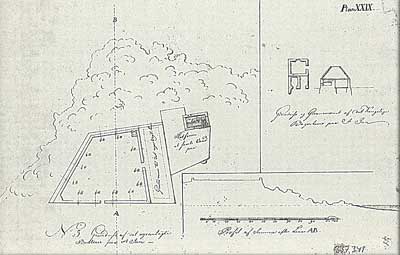
Fortification of Cruz Bay
(Oxholm 1780, Rigsarkivet, Copenhagen)In contrast to the relatively flat lands of St. Croix, St. Thomas and St. John represented perplexing cartographic problems. Oxholm’s initial notes include the observation that these islands are “nothing but mountains and cliffs, where it is almost everywhere impossible to survey or prepare a geographic large-scale map before one has first cut lines and ways through the bush to ‘get through on” (Hopkins 199J:36; VIFR 1777-1778). He therefore asked for permission to finish work on the forts and return home. He amplified his argument by adding that if he were “to remain here longer for the sake of surveying the islands, the forts and buildings would become even more dilapidated, and thus cost even more to repair” (Hopkins 1993:36; VIFR 1777-1778). Fortunately for us his request was rejected and he continued on to map St. John.Daniel Hopkins points out that the Danish Royal Court’s response was direct and to the point. The Court wrote: “We wish that Lieutenant Oxholm shall remain in our West Indian islands until he has also attended to the geographic mapping, required of him in his orders, of St. Thomas and St. John.” Hopkins asserts two key reasons for the court’s insistence. The first was that the Crown had invested heavily in the expansion of free trade and anticipated the opening of world markets—and particularly expanding North American markets—through its Caribbean holdings at the conclusion of the American Revolution. The second, more whimsical, reason related to Prince Frederik’s, son of Frederik V, being enamored with maps. He would ultimately accumulate one of the finest collections of historic maps in the world. His collection was compiled in a 55-volume atlas housed in the Danish National Library (Hopkins 1993:37)[5] “Hence, it can be said that maps for the sake of maps—were in vogue within the Royal Court and Oxholm was thus ordered to continue on in his work.”[6]Mapping St. John (1780 and 1800)Peter Oxholm’s two detailed maps of St. John were used as the basic geographic guide to the estates, roadways, customs houses, towns, and general landscape of the island (Oxholm 1780a, 1800). It was not until after the 1917 transfer of the Danish West Indies to the United States that a new U.S. Geological Survey (1918) map was made. The history of these maps reveals much about both the history of the island and the difficulty of mapping this island in the era prior to aerial photographs and GPS.Through the centuries, St. John’s steep slopes and dense vegetation (both verdant foliage and impenetrable xerophytic cacti and acacia, depending on where you are on the island) have turned away surveyors before and after Peter Oxholm. In submitting his 1780 map of St. John, Oxholm noted that “[t]his island has hitherto been only very little known, and no surveyor map of any part of it has yet been done, before the present one, which lacks nothing except each plantation’s particular boundary lines, which because of the shortness of time, as well as its virtual impossibility, I have not been able to include in the drawing” (DVFV-I 1780, in Hopkins 1993:43).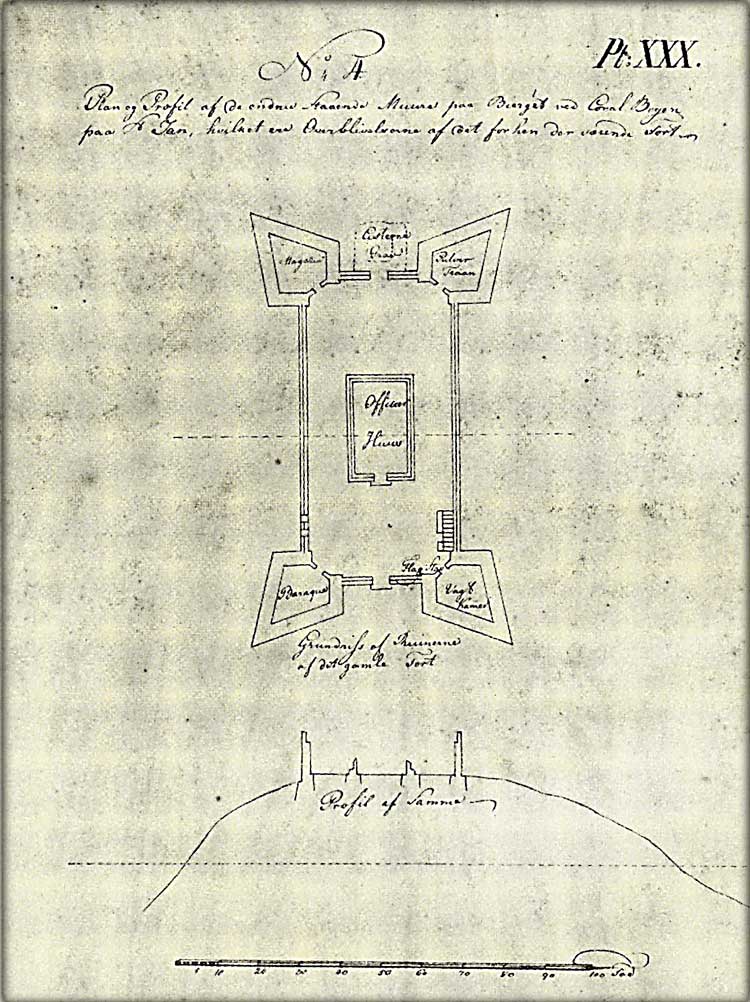
Fort at Coral Bay
(Oxholm 1780, Rigsarkivet, Copenhagen)Oxholm’s notes and letters reflect the difficulty that he had with the terrain and in reconciling information on landownership (tax records), estate boundaries, and survey access. He stated: “I made the most of the small time I had left to at least in some regards fulfill the demand for a map of this island …for had I completed the most accurate large-scale survey, a period of many months, perhaps even years, would have been demanded, as most of the whole island is still in bush.”Oxholm’s records are replete with details pertaining to the cultural landscape of St. John. Included among the documents he submitted to the Crown was a draft map of the island dated 1777. This map includes information from Oxholm’s initial coastal survey and schematic representations of fortifications and a detailed listing of names of harbors, bays, and moorings. Each of these variables was explicitly defined as priorities for evaluating the defense of the island (and perhaps more importantly the defense of the port of Charlotte Amalia on St. Thomas). Oxholm’s most detailed drawing is of the fortification at Cruz Bay. This was a newly constructed battery, completed at a cost of 9,000 Riksdaler, but funds had not been sufficient to complete the guard house. Oxholm suggested that completion of the project could be funded by selling the barracks to a private individual for use as a storehouse. With respect to the old fort at Coral Bay, Oxholm commented that the location of this fort was good for defense but that the remains of the building he visited were inadequate. He went on to lament the recent expenditure of funds on the less strategic fort at Cruz Bay while the fort overlooking Coral Bay remained in a state of ruin.These maps and their accompanying commentary demonstrate the priorities of Oxholm in pursuing his mapping. Moreover, his notes repeatedly indicate that he was at best unsold on the economic viability of the island and he qualified his recommendations for enhanced fortifications with statements such as “[a] tremendous opportunity is given by the numerous points to fortify and defend St. Jan, if it will ever be worthy of such plans“ (DVFV-I 1780). In particular, he pointed out the strategic location of Turner’s Point on the southeast entry to Coral Harbor. In fact, no significant modifications were made to the infrastructure of fortifications, a lack of action consistent with the relative importance of the island within the infrastructure of the Danish West Indies.Oxholm described a survey expedition on St. John that was fraught with hardships relating to the difficult terrain of the landscape that he was mapping. He also described living conditions that appalled him. In his survey work, he encountered almost totally isolated “fisher folk“ who clung to existence on the points of land enclosing Coral Bay and on the east end of the island: “Yams and fish with a drink of puddle water is all their food, and a stranger among them is regarded as a wonder. Along my way out there, where I roamed for 5 days, a little bread, a piece of salt meat, a crock of water, a crock of wine, with my hammock and my coat, were my daily company and provision; not even my negroes could find nourishment there, but had to bring food with them“ (DVFV- 11780). While Oxholm’s observations relate specifically to the eastern section of St. John, for the island as a whole he depicted the ubiquitous nature of impenetrable bush.Ultimately, he opted not to map plantation boundaries as Beck did on St. Croix, as it would simply have required too much time and expense to perform the cutting of bush required for a proper survey (Hopkins 1988). From his notes we learn that even near the apex of sugar production on the island. the proportion of cleared lands for sugar production represented only a small portion of the overall acreage. The overall landscape was one of impenetrable vegetation and steep slopes-all in sharp contrast with the plantations of St. Croix. Oxholm did document the location of quarter[2] boundaries representing the administrative division of the islands into groups of estates.The decision not to map the boundaries of each estate reflects the lack of formal demarcation of estate boundaries at the time of Oxholm’s survey. General boundaries between estates were apparently understood among the owners, but in many cases the interior boundaries were forested and within difficult terrain and thus never formally defined-at least through survey. This lack of finite boundaries indicates the lack of relative economic importance for such specific divisions and demarcation on St. John. Ultimately, the fact that these boundaries were not documented by Oxholm, as they had been on St. Croix, limited our ability to generate property-based polygons in our GIS database for each estate defined by Oxholm.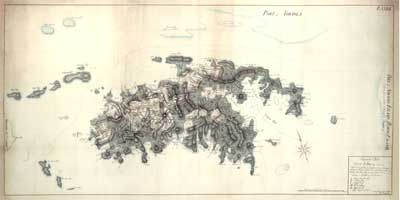
Oxholm’s map of St. John, 1780
(Rigsarkivet, Copenhagen)However, ruins and tangible evidence of archaeological sites were defined for virtually all of the sites recorded by Oxholm. The lack of information on property boundaries led us to emphasize the location of ruins, as they are tangible points associated with activity areas relating to habitation and production. This study examines these site- based data and uses grouped spatial data at the quarter level. Grouped comparative analysis of spatial trends by quarter allows for detailed comparisons of economic activities and demography across the island.[7]In submitting his 1780 map, Oxholm noted that it was not quite finished but that “the work on paper corresponds in every way to the endless difficulty I had with the surveying“ (VIJ 1780). While Oxholm might not have been satisfied, the Royal Court gave praise to this effort noting: “In particular, the large topographic map of St. John, which is the first single map available of this island, distinguishes itself among this handsome collection of maps.“ Hopkins’s examination of Danish records indicates that in addition to his agreed-upon salary and expenses, “the King rewarded Oxholm with a douceur of one thousand rigsdaler“ (VIFR 1781-1782).The history behind the 1800 map is not as clear and concise. We know that Oxholm had married a daughter of a St. Croix planter.[8] The 1800 map appears to have been a self-published version perhaps, as was customary at this time, on a contracted subscription basis for planters, businessmen, and island administrators. However, we do know that this new map reflected a detailed revision of land ownership that is accurate and consistent with the formal taxed properties that correspond with the 1800 tax list. In addition, the map reflects a significant change in the definition of properties that is probably linked to a rapid turnover in plantation ownership in the 20 years between the first map and its successor. The index to the 1800 map is keyed to plantations that are defined by geographic place names rather than owners, as it had been in 1780. This is an important shift that is a key element of our interpretive examination of the island’s changing cultural landscape.… From this record, it is clear that the primary reasons motivating the construction of maps were (1) the need to document defenses and fortifications and (2) the need to obtain a more complete picture of land use than could be gained by simply reading the tax records. The late-eighteenth century setting defines limitations in data collection that impact our ability to generate explicit site boundaries. Hence, while quarter boundaries are clearly depicted and can be used to generate polygons for direct comparison, for this era we cannot rely on maps to generate accurate, time-specific polygons for each individual estate. In fact, later mapping done to define lands for tax purposes at the time of transfer of lands to the United States provides a fairly accurate set of estate boundaries for most of the island. However, in initially focusing on the 1780 and 1800 maps we have not fully incorporated these polygons as we have yet to calibrate the records from the period of transfer (early twentieth century) with the estates of the eighteenth century. Such refinements are planned for follow-up projects as we focus on thematic questions relating to issues such as the social impacts of the transition from the Danish administration to the United States administration (one of several thematic studies that are now under way).
- Matricals are detailed land tax records recorded annually by the Danish colonial government and housed in the Rigsarkivet in Copenhagen, Denmark These records were transcribed and translated by David Knight. This project was funded in part by grants from the National Park Service, the Friends of Virgin Islands National Park, Syracuse University Continuing Education and Summer Sessions, and the College of Arts and Sciences of Syracuse University.↑
- A “quarter” represents an administrative division of the island that is roughly equivalent to a county or parish. For this chapter, we will focus on a comparison of the Maho and Coral Bay quarters.↑
- In fact, a manuscript relief map of St. Croix had been produced by Johan Cronenberg in 1750, but it was held by the Danish Admiralty and was apparently unknown to the Chamber of Customs.↑
- As an indication of priorities, “situation maps” of forts and harbors were to be done first.↑
- This map collection is currently housed in the National Library and is one of the finest in the world. The Oxholm maps are housed separately in the Rigsarkivet in Copenhagen.↑
- While awaiting orders, Oxholm traveled through the Lesser Antilles and was expelled upon arrival in Martinique for being a spy. Apparently, they were concerned about his keen interest in fortifications. On the way back to the Dutch West Indies Oxholm’s vessel and possessions were taken by British privateers As a consequence he asked for a significant retroactive increase in pay in compensation for his losses and for the cost of appearing before the British Admiralty court at Nevis and for the looting of his baggage. He described himself as nearly mined and in his correspondence to the Chamber he stated that “he would prefer to be relieved of his position, while yet strength and years allowed him to seek his bread elsewhere” (VIJ 1779).↑
- We anticipate generating parcel-specific polygons once we have incorporated the tax map records associated with transfer of the Danish West Indies to the United States. Using this information we can then generate a series of hypothetical estate boundaries by integrating spatial data from tax maps dating to the early twentieth century with the Oxholm maps and relative spatial information recorded in the matricals that span the history of Danish colonial occupation.↑
- Correspondence shows that in 1784 he received word that the Chamber had mislaid all his drawings and wished to be provided with a new set and that the effort to redraw these maps resulted in a renewal of survey work on his part over the next two years. Oxholm and his supporters attempted to have his map formally published by the Crown but this effort was not successful.↑